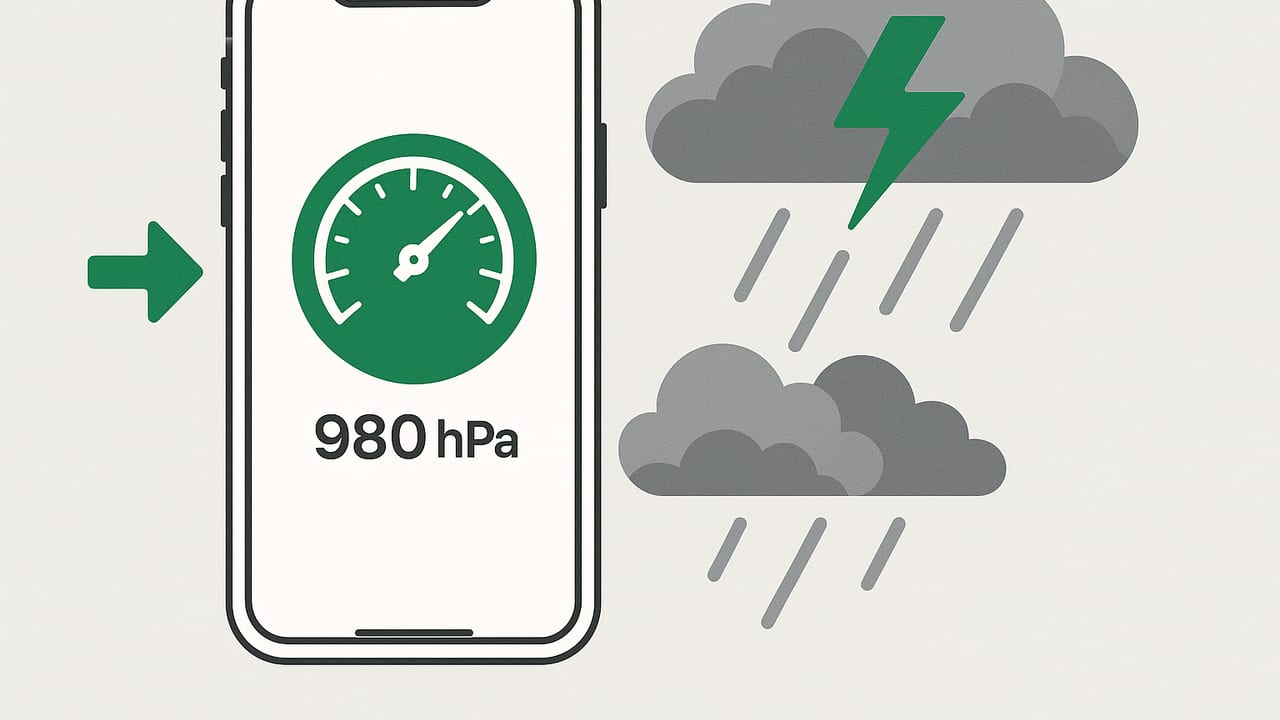
Can you really use an iPhone barometer to predict an approaching storm? Yes—if you focus on pressure trends, not just a single number. Modern iPhones (from iPhone 6 onward) include a micro‑barometric sensor that measures atmospheric pressure directly. With a bit of setup and a systematic approach, you can turn that reading into a practical early‑warning signal for fronts, squall lines, and tropical systems—without needing a data connection.
How Your iPhone’s Barometer Works
Inside your phone is a tiny pressure sensor that measures the weight of the air above you—barometric pressure. iOS exposes that reading to apps, typically in kilopascals (kPa), which many tools convert to hectopascals (hPa) or millibars (mb). Since 1 hPa = 1 mb and standard sea‑level pressure is 1013.25 hPa, you can think in either units.
The sensor reports absolute pressure at your current elevation. Pressure decreases with height—roughly 1 hPa for every 8 meters you go up. That’s why your barometer doubles as an altimeter: if pressure drops and you didn’t move, weather is changing; if it drops because you climbed stairs, it’s just altitude. The key idea for storm detection is the rate of change at a fixed place.
Unlike cloud‑based forecasts, your iPhone’s barometer works offline and updates continuously, so it can detect local pressure shifts even when service is spotty. That makes it especially useful on the water, in the backcountry, or during widespread outages.
Units, Sea‑Level Pressure, and Calibration
For weather comparisons, meteorologists use sea‑level pressure (SLP), sometimes called QNH. Your iPhone measures absolute pressure at your height. Many apps can apply an elevation correction so your reading matches SLP reported by nearby stations. This is helpful but not strictly necessary if you’re focused on trends.
- Absolute pressure: What your sensor measures where you are.
- Sea‑level pressure (SLP/QNH): Adjusted to what it would be at sea level; used for comparing with forecasts and stations.
- Units: hPa and mb are interchangeable; 1 kPa = 10 hPa = 10 mb.
Quick calibration tip: If you want SLP, note your elevation and compare your reading with a nearby official station (airport METAR). Some apps let you enter a correction so your value matches the station. If you can’t calibrate, watch the direction and speed of change; trend is what signals storm approach.
Why Trends Beat Single Readings
Pressure trends tell you about the movement and strength of weather systems. Ahead of low‑pressure systems and fronts, pressure usually falls. After the front passes, pressure often rises. Tropical cyclones produce a long, steady fall over many hours; squall lines can cause a rapid fall followed by a sharp rise with the gust front.
Meteorologists summarize this with pressure tendency terms: steady, falling, falling rapidly, rising, or rising rapidly. For practical storm prep, you can translate that into simple thresholds based on how many hPa your iPhone sees over a set period.
“When the glass falls low, prepare for a blow.” — Old mariner’s proverb
Practical Thresholds to Spot an Approaching Storm
Use these guideline thresholds while the phone remains at the same elevation. The values below assume sea‑level or absolute readings without elevation changes.
| Pattern | Pressure Change | Time Window | What It Often Means | Suggested Action |
|---|---|---|---|---|
| Steady or slight fall | 0 to −1 hPa | 3 hours | Minor instability or weak front | Keep routine plans; recheck in 2–3 hours |
| Moderate fall | −2 to −3 hPa | 3 hours | Approaching front/low; weather likely deteriorating | Secure outdoor items; plan earlier arrival times |
| Rapid fall | ≤ −6 hPa | 3 hours | Strong system or squall line likely | Delay exposed activities; check official alerts |
| Prolonged steady fall | −10 to −20 hPa | 12–24 hours | Deepening low or tropical system approaching | Review storm plan; charge devices and prep supplies |
| Sharp rise after a fall | +3 to +6 hPa | 1–3 hours | Front passage/gust front; clearing but gusty | Expect wind shifts; proceed with caution |
Note: Absolute values vary by location and weather. A reading below ~1000 hPa at sea level with continued falling often correlates with significant lows, but trend speed is your best early signal.
Setup Tips for Reliable Readings
- Keep elevation constant: Pressure changes ~1 hPa per 8 meters. Avoid stairs, elevators, and driving during trend checks.
- Avoid sealed environments: Car cabins and tightly sealed cases can lag real pressure. Let the phone equilibrate for 2–5 minutes.
- Minimize handling heat: Temperature swings can cause tiny sensor drift. Set the phone on a table away from vents and sun.
- Log at regular intervals: Note readings every 15–30 minutes or use an app with a trend graph.
- Compare with a station: To align with forecasts, calibrate to a nearby METAR station’s sea‑level pressure (QNH) once.
- Use offline mode when needed: The sensor works without internet; just ensure your app records locally.
Step‑by‑Step: Using an iPhone Barometer to Predict a Storm
- Pick a spot and stay put: Place the phone on a stable surface away from drafts.
- Record a baseline: Note pressure now and mark the time.
- Track the trend: Take readings every 15–30 minutes for at least 3 hours.
- Compute change: Subtract the current value from your baseline to get ΔP. Divide by hours to get hPa/hour.
- Classify the trend: Use the threshold table above to interpret falling or rising rates.
- Cross‑check: If possible, compare with a local station trend to verify.
- Decide and act: Adjust plans, secure gear, or seek shelter based on the trend—especially during rapid falls.
Common Storm Signatures in Your Pressure Log
Cold Front or Squall Line
Pattern: A steady fall for 1–3 hours, sometimes accelerating to a rapid drop, followed by a sudden wind shift, a quick pressure jump, and cooler air. Thunderstorms may accompany the sharpest drops.
What to do: At the first sign of a rapid fall (≥ −2 hPa/hour), finish high‑exposure tasks early, secure loose items, and be ready for gusty outflow.
Tropical System (Far Outer Bands to Close Approach)
Pattern: A long, smooth decline over many hours to days, sometimes punctuated by small oscillations with rain bands. The closer the core, the lower the pressure; falls can exceed −20 hPa in 24 hours near stronger systems.
What to do: Use the trend as an early cue to start staged preparations. Monitor official advisories; the barometer confirms local progression even when forecasts are delayed or connectivity is limited.
Troubleshooting and Myths
- “Indoor vs. outdoor changes don’t matter.” Mostly true; buildings equalize quickly. But sealed rooms or vehicles can lag by minutes.
- “My phone jumped 4 hPa in a minute—storm!” Probably not. That’s more consistent with an elevator, door slam, or pressure equalization.
- “Temperature ruined my reading.” Sensor drift from temperature is minor compared with genuine weather trends; let the phone equilibrate for best stability.
- “I need perfect calibration.” Not for detection. Rate‑of‑change at fixed elevation is the signal you need.
For the Curious: How Apps Read Pressure on iOS
Developers access the barometer via Core Motion’s CMAltimeter. The API provides pressure and relative altitude updates. Here’s a minimal Swift example that logs pressure in hPa:
import CoreMotion
let altimeter = CMAltimeter()
if CMAltimeter.isRelativeAltitudeAvailable() {
  altimeter.startRelativeAltitudeUpdates(to: .main) { data, error in
    guard let data = data, error == nil else { return }
    // iOS reports pressure in kilopascals (kPa)
    let pressureHpa = data.pressure.doubleValue * 10.0 // 1 kPa = 10 hPa
    print(String(format: "Pressure: %.1f hPa", pressureHpa))
  }
}
Apps typically convert kPa to hPa/mb and graph the time series so you can see trend lines and compute hourly rates automatically.
Safety First and Final Tips
- Use your barometer as a supplement to official watches and warnings, not a replacement.
- Watch for consistent falls over set windows (3, 6, 12 hours), not momentary dips.
- Combine pressure with sky, wind, and radar observations for the best picture.
If you prefer a simple, offline barometer with clear trend graphs bundled alongside tools like a bubble level, compass, and metal detector, the Level Tool iOS app leverages your device’s sensors to provide accurate, subscription‑free readings you can trust when connectivity is limited.
