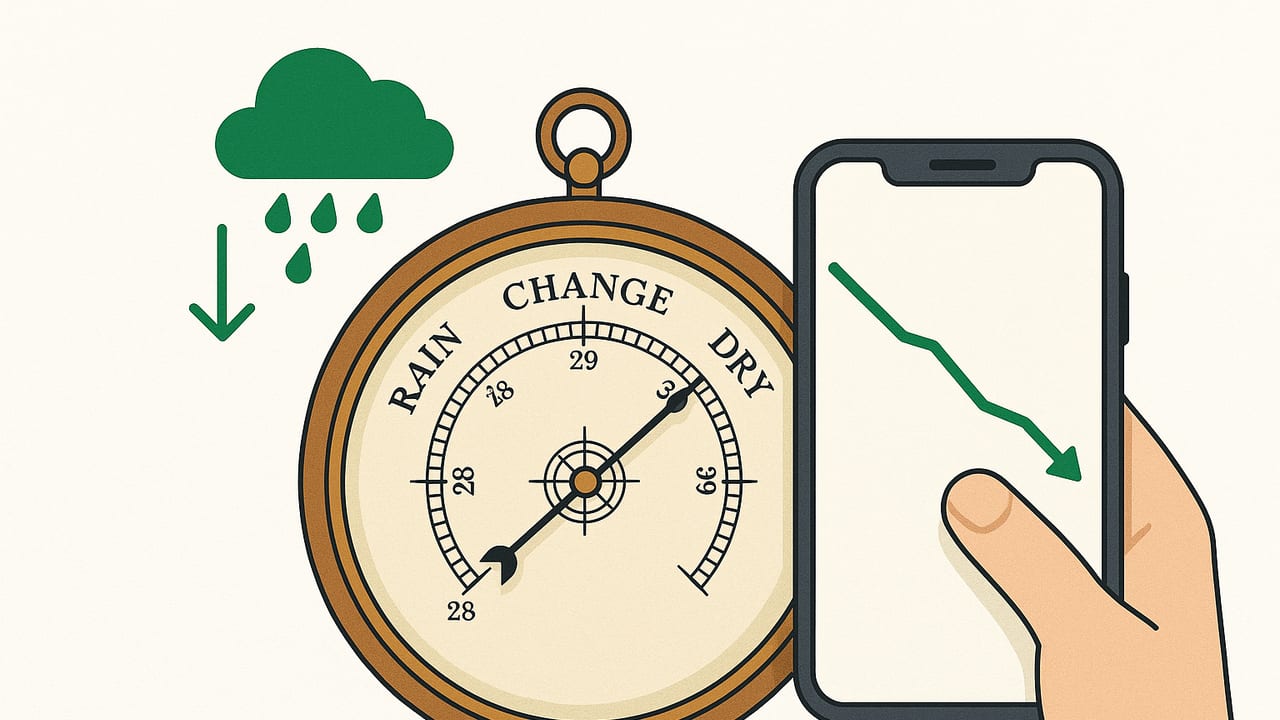
If you rely on your phone or a handheld sensor to watch the weather, nothing is more useful than an accurate barometer reading for storm prep. Barometric pressure isn’t just a number—it’s a leading indicator of approaching systems, wind shifts, and precipitation potential. This guide explains how barometers work, how to calibrate them correctly, how to interpret pressure trends, and how to build a simple routine that turns your readings into actionable preparation.
Barometric Pressure Basics You Actually Need
Barometers measure the weight of the air above you. Lower pressure often signals rising air and unsettled weather; higher pressure usually points to sinking air and calmer conditions. But to use pressure wisely, you need to know what you’re looking at:
- Units: Most weather sources use hectopascals (hPa), also called millibars (mb). In the U.S., inches of mercury (inHg) is common. Quick conversion: 1013.25 hPa ≈ 29.92 inHg.
- Station pressure vs. sea-level pressure: Your sensor measures station pressure—the pressure where you are. Forecast maps and airport reports typically use sea-level pressure (SLP) or QNH so locations at different elevations can be compared.
- Why this matters: Two people at different elevations can read very different station pressures at the same time. Converting your station reading to SLP makes your number comparable to official forecasts and helps you spot meaningful trends.
How to Get an Accurate Barometer Reading for Storm Prep
Good barometer practice starts with reducing noise and bias. Small mistakes in setup can easily swamp the weather signal you care about.
- Place the device smartly: Avoid direct sun, car dashboards, radiators, or air vents. Heat can cause pressure to drift. A shaded, well-ventilated indoor spot away from HVAC blasts is best.
- Let it stabilize: Give your device a few minutes after big temperature changes (e.g., bringing it inside) to settle before logging readings.
- Pick a consistent time: Read at regular intervals—top of the hour is ideal. Consistency makes trends clearer.
- Know your elevation: Keep your location’s elevation handy. Use a topographic map, a reputable mapping app, or local survey data. GPS elevation is okay but can be off by tens of meters.
- Record temperature: Ambient temperature helps with a more accurate sea-level conversion (and can explain odd blips in pressure).
Calibrating Your Reading: From Station to Sea-Level
To compare your reading with official sources (and to interpret weather thresholds reliably), convert station pressure to sea-level pressure (SLP). You can do this in two practical ways:
- Match a nearby official station (quick, robust):
- Find a nearby airport METAR or trusted weather station’s QNH/SLP.
- Take your station pressure reading at the same time.
- Apply an offset so your reading matches the official value, accounting for your elevation difference. Recheck every few weeks or after large weather swings.
- Use the hypsometric equation (more precise with good inputs):
- Measure station pressure (P), altitude (h), and estimate mean layer temperature (T̄) in Kelvin between your elevation and sea level.
- Compute SLP using the formula below. This is especially useful if you’re far from any reliable station.
Swift example: Convert station pressure to sea-level pressure
// Convert station pressure (hPa) to sea-level pressure (hPa)
// Inputs:
//   P_hPa: station pressure in hPa
//   h_m:   elevation above sea level in meters
//   T_C:   ambient temperature in °C (approx. near the sensor)
// Notes:
//   Uses the hypsometric equation with a standard lapse-rate estimate.
//   For best results, use outside air temperature and a trustworthy elevation.
import Foundation

func seaLevelPressure(P_hPa: Double, h_m: Double, T_C: Double) -> Double {
    let g = 9.80665            // m/s^2
    let R_d = 287.05           // J/(kg·K)
    let lapse = 0.0065         // K/m (standard)
    let T0 = T_C + 273.15      // K, near-surface temperature
    // Approximate mean layer temperature between station and sea level
    let T_mean = T0 + 0.5 * lapse * h_m
    // Hypsometric equation: ln(P0/P) = (g * h) / (R_d * T_mean)
    let exponent = (g * h_m) / (R_d * T_mean)
    let P0_hPa = P_hPa * exp(exponent)
    return P0_hPa
}

// Example:
// let P0 = seaLevelPressure(P_hPa: 987.2, h_m: 220.0, T_C: 12.0)
Tip: If you can find a trustworthy airport QNH within 25–40 km and similar elevation, using the offset method is often just as good in practice. Recalibrate after pressure sensors experience temperature extremes or if you move locations significantly.
Reading Trends: What the Numbers Mean for Storm Prep
Storm preparation depends more on trends than on one-off values. A rapid fall often points to strengthening winds and precipitation; a quick rise after a front can signal clearing and gusty post-frontal conditions. Use the table below as a field-oriented guide, not a guarantee.
| 3-hour trend (hPa) | Likely situation | Preparation actions |
|---|---|---|
| Fall > 6 hPa | Rapid deepening; strong front or gale possible | Secure outdoor items, check batteries, review evacuation or shelter plan |
| Fall 3–6 hPa | Notable system approaching | Top off fuel/water, test sump pumps, ready rain gear and tarps |
| Fall 1–3 hPa | Weak to moderate system | Monitor radar/alerts, clear drains, charge devices |
| Steady (±1 hPa) | Little change | Routine checks only |
| Rise 3–6 hPa | Post-frontal clearing, gusty winds possible | Inspect for loose branches, resume outdoor work cautiously |
Pressure trends are a decision aid—not a forecast. Always cross-check with official alerts and local radar when severe weather is possible.
Common Sources of Error (and How to Fix Them)
- Elevation uncertainty: A 30 m error can shift sea-level pressure by roughly 3–4 hPa. Use a mapped elevation, not a one-off GPS reading.
- Temperature biases: Warm surfaces (sunlit window sills) cause sensor drift. Shade your device and let it stabilize for a few minutes.
- Indoor pressure gradients: Exhaust fans, HVAC, or open doors can nudge readings. Measure away from vents and compare indoors vs. outdoors; pick the more stable location.
- Movement and sealing: Pressing your phone into a case or pocket can transiently change pressure channels. Read with the device out in open air.
- Data smoothing: Many apps smooth pressure to reduce noise. That’s helpful, but excessive smoothing hides real changes. If possible, log both raw and smoothed values.
Build a Simple Storm-Prep Barometer Routine
- Pick a reference: Choose a nearby airport METAR or trusted station to periodically verify calibration.
- Log at consistent times: Top of every hour is ideal. Note SLP (or station + elevation), temperature, and brief weather notes.
- Track 3-hour deltas: Compute change over the last 3 hours and mark large moves (e.g., ≥3 hPa) with a different color.
- Set thresholds: Create simple rules: “If fall ≥3 hPa/3 h, tie down patio items and check pumps.”
- Cross-check: When you see a rapid fall, open your local radar and consult official advisories.
- Review weekly: Revisit calibration against your reference station and update your elevation or temperature practices if needed.
Practical Examples
Coastal low moving in
Noon: 1016 hPa. 3 PM: 1010 hPa. 6 PM: 1003 hPa, gusts rising. That’s a 13 hPa drop in 6 hours—rapid deepening. Actions: secure outdoor furniture, charge devices, prep flashlights and sump checks. Expect rain and increasing wind; watch for advisories.
Mountain valley late-day storm
2 PM: 1012 hPa. 5 PM: 1009 hPa with building clouds. The fall is moderate, but in steep terrain local winds and terrain-induced pressure anomalies are common. Actions: wrap up ridge hikes early, verify shelter options, monitor lightning.
FAQ: Making Sense of the Details
Do I really need sea-level pressure?
If you’re comparing to forecasts or another station, yes—use SLP. If you only track your own trend on the same device in the same location, station pressure is fine, as long as your elevation and setup don’t change.
How accurate are smartphone barometers?
Modern phone sensors are typically very stable for relative changes and can be within ±1–2 hPa after calibration. That’s more than sufficient for storm prep, where trend magnitude matters most.
What about hPa vs. inHg?
Use whichever unit you’re most comfortable with. To convert: inHg ≈ hPa ÷ 33.8639. A “standard” pressure is 1013.25 hPa (29.92 inHg). Meaningful differences for storm prep often show up as a few hPa over a few hours.
My altitude isn’t precise. What should I do?
Use a map-derived elevation for your home base and stick with it. Then periodically match your reading to a nearby airport QNH to maintain an accurate offset.
Pro Tips for Better Storm Decisions
- Use pressure with wind and temperature: A falling pressure paired with a wind shift from southerly to westerly often signals frontal passage.
- Watch continuity: One noisy reading means little; three consistent readings tell a story.
- Consider your microclimate: Coastal, urban, and mountainous areas can exaggerate wind and rainfall for the same pressure trend.
- Log once, act twice: After each notable fall, take two actions—one to reduce risk (secure items) and one to increase resilience (charge power banks).
Bottom Line
For storm preparation, an accurate barometer is a simple, powerful tool—especially when you calibrate it to sea level, read it at consistent times, and focus on 3-hour trends. Pair those trends with official alerts and local radar, and you’ll turn raw pressure numbers into timely, practical actions. If you prefer an iOS app that reads your device’s sensor offline and keeps all your measurement tools in one place, Level Tool includes a barometer alongside a compass, bubble level, and more.
